Calli Morales

Results
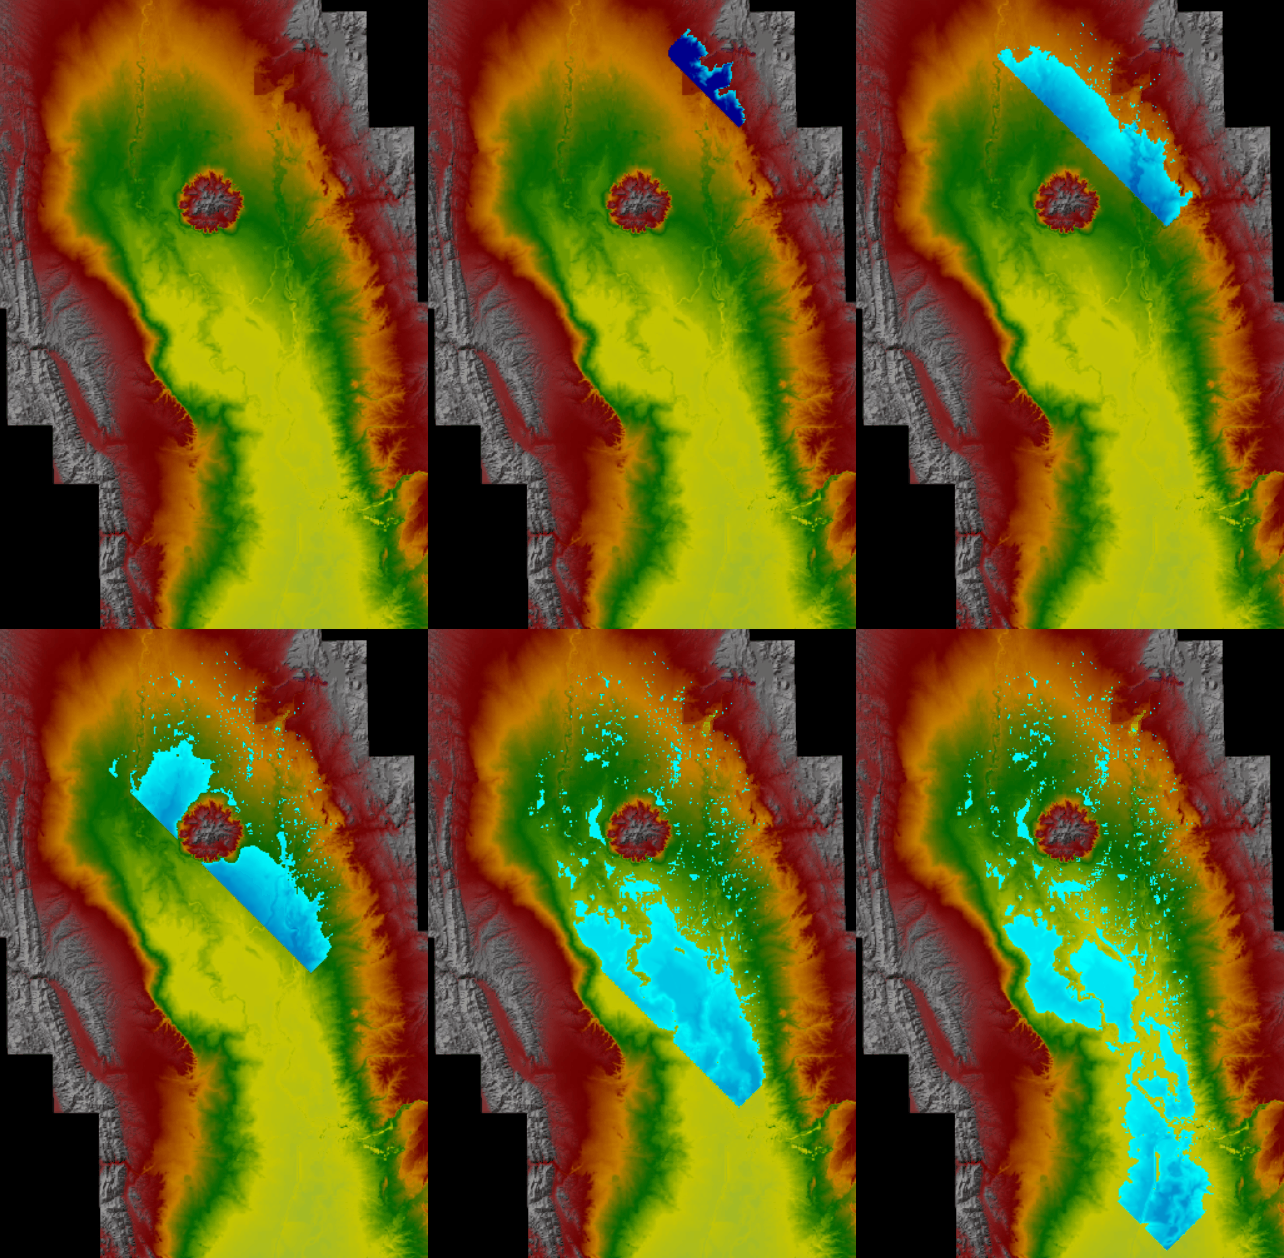
These images illustrate the total affected area from the water flow pour point. In the illustration, inundation begins at the Oroville Dam location and end near Sacramento. The image below illustrated the inundated areas of the city of Sacramento.


As for the NDVI maps, they were both created on ENVI using Landsat imagery. In an attempt to show the differences in time, we attempted to create an NDVI map from 1987 and 2016 (the most current image available that did not have clouds obstructing the view or interfering with our data analysis.


As you can see, there is a dramatic difference between both time frames. However, what was not taken into account while making this analysis was that these images were taken in different times of the year. While the image from 1987 was taken in August 15, the image from 2016 was taken in November 18. This may be the explanation as to why the image from 2016 has less healthy vegetation than the image from 1987. One of the indicators that the NDVI analysis is more accurate than completely wrong is that the water bodies within the area have a low NDVI value.

In order to better visualize the effects from our simulation, vegetation and cropland were mapped underneath the maximum affected area to better represent the possible effects to humans outside of the flood-hazard zone. On top of having the dam spillage overlaid with the vegetation, we also highlighted the high NDVI values and overlaid it with the affected areas from the dam spillage. This is just to visualize all of the healthy crops that would be affected from water erosion.


Nearby towns would be destroyed, including Oroville, Marysville, Live Oak, and Yuba City.
More than 100,000 that live in the region would be displaced. however if inundation levels reach Sacramento, depending on the threat, an additional 500,000 people would be displaced.
Crop and farmland would be inundated spiking the cost of food for nearly all of the U.S.
Extreme water shortages (61% of water for the California State Water Project relies on water from the Oroville Dam)
Energy shortages would be apparent along California. One third of all energy in California is produced at the Oroville Dam site.